> ## Documentation Index
> Fetch the complete documentation index at: https://docs.cockroachlabs.com/llms.txt
> Use this file to discover all available pages before exploring further.
# Cockroach Aegis Overview
export const InternalLink = ({version, path = "", children, ...props}) => {
let detectedVersion = version || "stable";
if (typeof window !== 'undefined' && !version) {
const match = window.location.pathname.match(/\/docs\/([^/]+)/);
if (match) {
detectedVersion = match[1];
}
}
const normalizedPath = path.startsWith("/") ? path.slice(1) : path;
return
{children}
;
};
**This feature is in private preview** and is only available to enrolled organizations. To enroll your organization, contact your Cockroach Labs account team or [sign up for the preview](https://deploy-preview-1023--cockroach-labs-marketing.netlify.app/preview-aegis/). This feature is subject to change.
Cockroach Aegis is a managed service that monitors your CockroachDB clusters, investigates changes in cluster health and workload performance, and recommends actions for you to take based on what it finds. It is built on an **agent harness** designed specifically for monitoring and troubleshooting CockroachDB.
Aegis supports both proactive tuning and reactive troubleshooting. It can identify opportunities to improve a workload before an incident, or investigate a change in latency, throughput, or cluster health when a problem occurs. It complements your existing monitoring tools with CockroachDB-specific analysis.
Benefits of Aegis include:
* Continuous, CockroachDB-aware monitoring that builds up context about your cluster over time.
* Intelligent alerting and automatic investigations. When Aegis detects an anomaly or a potential issue, it opens an investigation and gathers the evidence itself, so you do not start from square one.
* Recommendations that include supporting evidence and, where applicable, SQL for you to review and run. Recommendations are the primary information channel that you should pay attention to.
* Periodic reports that explain what is happening on the cluster.
* [Ask Aegis](#ask-aegis-cluster-aware-qa), a conversational user interface for questions about your cluster.
* An [MCP endpoint](/docs/continuum/aegis-agentic-ecosystem#connect-through-mcp) that lets your own agents access Aegis's analysis.
By default, Aegis's access to your cluster is read-only. It can only make recommendations about changes to make, which you can review and apply through your normal change process.
This page describes:
* How Aegis monitors your cluster through [check-ins](#automatic-monitoring-through-check-ins).
* How [alerts and investigations](#intelligent-alerting-and-investigations) turn detected conditions into analysis.
* How to read [reports and recommendations](#reports-and-recommendations).
* How Aegis [uses accumulated context](#adaptive-learning), and how to steer it with custom instructions.
* How to use the [Aegis web UI](#use-the-aegis-web-ui) and Ask Aegis.
For information about connecting agents to Aegis, see [Agentic Ecosystem](/docs/continuum/aegis-agentic-ecosystem).
For information about connecting a cluster, permissions, and data handling, see [Security and Administration](/docs/continuum/aegis-security-and-data-access).
## Automatic monitoring through Check-ins
Aegis reads cluster signals through a connection to your cluster, and records its analysis in a hosted service maintained by Cockroach Labs.
A *check-in* is a periodic review of a cluster and its workload. During a check-in, Aegis compares current signals with its previous observations, refreshes its reports, and investigates conditions that warrant attention.
Each check-in starts with Aegis reading the latest cluster and workload reports and any open investigation records, then using its tools to observe the cluster. What it records feeds the next check-in:
* *Reports* carry updated cluster and workload context forward.
* *Investigations* track deeper analysis of anomalies.
* *Recommendations* surface actions for you to take.
This cycle lets Aegis follow changes over time rather than analyzing each observation in isolation.
Aegis schedules its next check-in based on what it finds. A healthy cluster is checked less frequently, and a condition that needs follow-up prompts an earlier check-in. An alert rule can also trigger a check-in ahead of schedule. For example, an alert rule that detects underreplicated ranges can wake Aegis to investigate the change, update the cluster report, and produce a recommendation if action is needed.
To request a check-in on demand, click **Check in** on **Home** or in the **#check-ins** channel. Requesting a check-in is a [web UI](#use-the-aegis-web-ui) action. Retrieving a report through MCP returns the latest completed analysis and leaves the check-in schedule unchanged.
A check-in can carry an existing report forward unchanged. To find out whether a report reflects a recent change, check the observation times inside the report. When you retrieve reports through MCP, each report's `changed`, `created_at`, and `version_id` fields show whether that check-in rewrote it. For details, see [Verify the MCP connection](/docs/continuum/aegis-agentic-ecosystem#verify-the-mcp-connection).
Interpret findings in the context of your cluster's topology and recent changes. For example, a single-node cluster cannot satisfy a [replication factor](/docs/stable/configure-replication-zones#num_replicas) of 3, so Aegis reports its ranges as [underreplicated](/docs/stable/cluster-setup-troubleshooting#replication-issues). That finding reflects a resilience limit of that configuration rather than a new failure.
## Intelligent Alerting and Investigations
Aegis uses alert rules and investigations to turn detected conditions into analysis and possible next steps.
* An *alert rule* defines a condition to evaluate against cluster metrics or SQL query results.
* An *alert* records that a rule's condition was met, and can trigger a check-in.
* An *investigation* records Aegis's analysis of a problem across check-ins, including the evidence it gathers and the hypotheses it evaluates. You can inspect investigations in the [web UI](#find-reports-recommendations-and-activity).
Aegis opens an investigation during a scheduled check-in or when an alert rule triggers one. It can also create alert rules to monitor conditions it identifies.
An investigation tracks the analysis of a condition and has its own criteria for when it is complete. When the analysis identifies an action for you to take, Aegis records a recommendation. An investigation can also conclude without producing a recommendation.
## Reports and Recommendations
Aegis produces two kinds of output: reports that describe the cluster and its workload, and recommendations that describe actions for you to take.
### Reports
Aegis maintains two reports for each cluster:
* The *cluster report* describes topology, configuration, resource utilization, and health.
* The *workload report* describes the workloads running on the cluster and their performance characteristics, such as query throughput and latency.
Aegis carries these reports between check-ins and updates them as conditions change. Read them in the web UI to understand the latest observed state, or provide them to your own agents through [MCP](/docs/continuum/aegis-agentic-ecosystem#connect-through-mcp).
For example, in a [controlled TPC-C test](/docs/continuum/aegis-example-workflows#understand-transaction-contention), the initial reports described an idle cluster. After the workload started, the updated workload report identified TPC-C traffic and attributed increased latency to contention on frequently updated `warehouse` and `district` rows, while the cluster report showed available CPU and disk capacity. Together, the reports distinguished workload contention from resource exhaustion. To reproduce this kind of comparison, see [Analyze a workload change through MCP](/docs/continuum/aegis-agentic-ecosystem#analyze-a-workload-change-through-mcp).
### Recommendations
A recommendation contains an action, an explanation of why it matters, and the evidence behind it: the metrics, queries, or statistics Aegis observed, and links to relevant CockroachDB documentation. When the action can be expressed as SQL, the recommendation includes the statement for you to review. Examples include adding or dropping an index, changing a cluster setting, or investigating intermittent node restarts using information from outside the cluster.
To act on a recommendation:
1. Review the proposed action and its supporting evidence.
2. Apply the change through your normal review and change process.
3. Compare subsequent reports and workload behavior with the evidence that prompted the change.
4. Mark the recommendation done or dismissed.
Aegis never applies its own recommendations. If new information changes the advice, Aegis withdraws the recommendation and records a replacement, preserving the history of the earlier advice.
A recommendation is the most important piece of information that Aegis surfaces to you. If you pay attention to nothing else Aegis does, you should read the recommendations.
#### Why might there be no recommendations?
A check-in can update the reports without identifying an action to recommend. An empty recommendation list means Aegis found nothing to recommend from what it observed. Read the reports for the observations and explanations behind that result, and for any limits on what Aegis could observe.
For example, in the TPC-C test described in [Understand transaction contention](/docs/continuum/aegis-example-workflows#understand-transaction-contention), Aegis identified candidate indexes but did not recommend them. Its workload report explained that those indexes targeted queries contributing little to the workload's execution time and would not address the dominant row contention. The report explained the performance issue without proposing an index change.
## Adaptive Learning
Aegis uses its history of observations, reports, investigations, and recommendations to keep its analysis specific to your cluster. For example, it detects a workload change by comparing current activity with an earlier report, and it remembers which recommendations it has already made.
You can add your own context with **Custom Instructions**, which Aegis includes in every check-in. In the cluster workspace, go to **Custom instructions**, enter the context, and click **Save**. Use custom instructions to add business context that Aegis can't get from the cluster directly, such as a known issue, an intentional configuration choice, a planned migration, or an occasional analytics workload whose longer-running queries are expected.
Adaptive learning means accumulating and using this cluster-specific context during analysis. Your cluster metadata and interactions with Aegis are not used to train or fine-tune AI models. For more information, see [How Aegis uses AI](/docs/continuum/aegis-security-and-data-access#how-aegis-uses-ai).
## Use the Aegis web UI
The Aegis web UI provides a place to review the connected cluster's state, explore the evidence behind a recommendation, and ask questions through Ask Aegis. To give your own agents access to the same context using tools such as MCP, see [Agentic Ecosystem](/docs/continuum/aegis-agentic-ecosystem).
### Open a cluster workspace
After you enroll and connect a cluster, sign in to Aegis with your CockroachDB Cloud account and open the cluster's workspace. The cluster name appears in the workspace header. For prerequisites, see [Security and Administration](/docs/continuum/aegis-security-and-data-access).
**Home** summarizes the latest reported cluster and workload state, open recommendations, and recent check-ins.
*Home brings together the connected cluster's latest summary, recommendations, and check-in history.*
### Find reports, recommendations, and activity
Use the workspace navigation to find the information relevant to your task:
| Destination | Use it to |
| ----------------------- | -------------------------------------------------------------------------------------------------------------------------------------------- |
| **Home** | Review the current summary, recommendations, and recent check-ins. |
| **Recommendations** | Read an action's supporting evidence, proposed SQL, and status, and, for withdrawn recommendations, the reason the action no longer applies. |
| **#check-ins** | Review the history of check-ins. Use an entry's **Updated reports** and **Transcript** controls to inspect its reports and activity. |
| **Alerts** | Inspect the alert rules Aegis monitors and their current state. |
| **Custom instructions** | Provide ongoing cluster context for check-ins, as described in [Adaptive Learning](#adaptive-learning). |
*An index recommendation after the index was applied. Aegis retains the finding, evidence, and proposed SQL, marks the status `withdrawn`, and records the reason the action no longer applies.*
When investigations are open, they appear in the **Investigations** section. For more information, see [Intelligent Alerting and Investigations](#intelligent-alerting-and-investigations).
To request a check-in from the workspace, click **Check in** in the **Check-in cadence** panel.
For worked examples of interpreting contention and acting on an index recommendation, see [Aegis Example Workflows](/docs/continuum/aegis-example-workflows).
### Ask Aegis: Cluster-aware Q\&A
To open Ask Aegis, select **#ask-aegis** in the workspace's **Channels** section. Ask a question about the cluster, or follow up on a report or recommendation.
Ask Aegis has access to the same cluster context and tools that Aegis uses during check-ins, and it can consult the CockroachDB documentation to explain its answers. For example, ask:
* How is this cluster looking overall right now?
* What changed in this cluster's workload since the previous check-in?
* What evidence supports this index recommendation?
* What did the investigation find about the increase in latency?
In the conversation shown below, the answer to the first question described an idle, healthy cluster, noted the single-node cluster's lack of fault tolerance, and cited the cluster and workload reports along with fresh metrics, node-liveness, and event-log observations. When you assess an answer, compare the report times with the observation window it states, since a report and a live observation can describe different periods.
*An Ask Aegis conversation about a cluster's health, including the answer's stated sources and observation window.*
## Demo video
For a demonstration of how to use Cockroach Aegis, watch the following video:
## See also
* [Agentic Ecosystem](/docs/continuum/aegis-agentic-ecosystem)
* [Security and Administration](/docs/continuum/aegis-security-and-data-access)
* [Aegis Example Workflows](/docs/continuum/aegis-example-workflows)
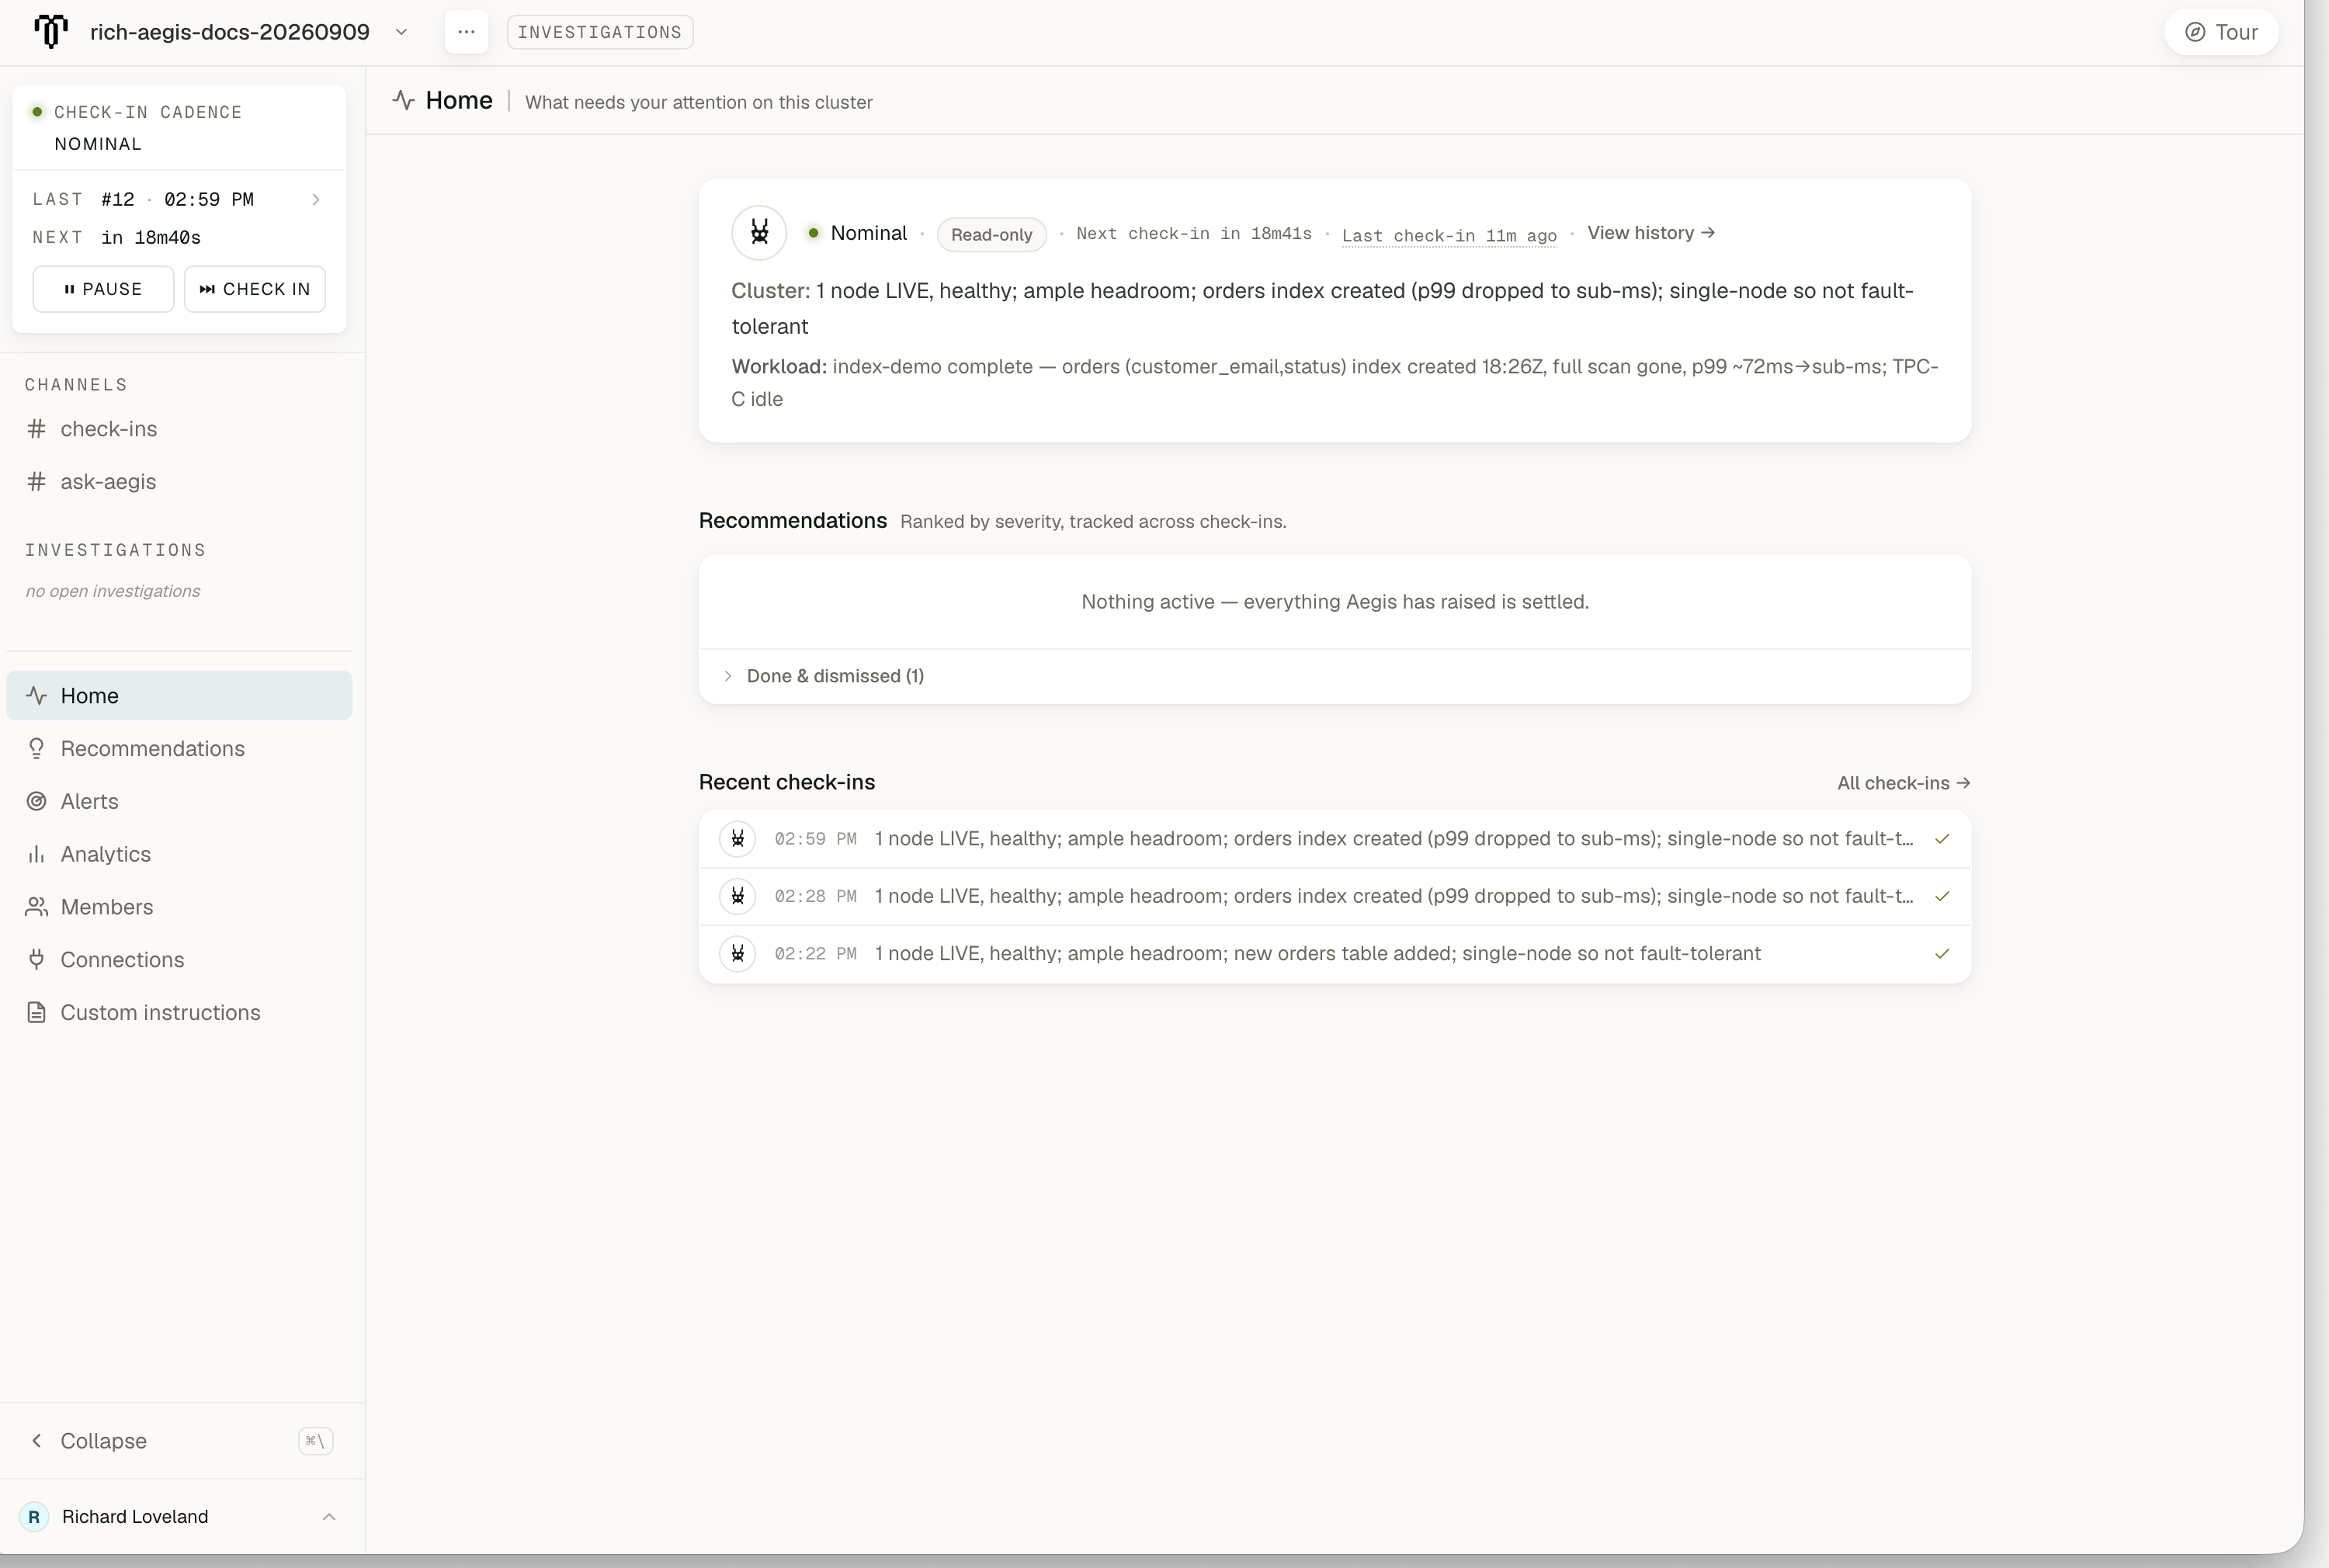 *Home brings together the connected cluster's latest summary, recommendations, and check-in history.*
### Find reports, recommendations, and activity
Use the workspace navigation to find the information relevant to your task:
| Destination | Use it to |
| ----------------------- | -------------------------------------------------------------------------------------------------------------------------------------------- |
| **Home** | Review the current summary, recommendations, and recent check-ins. |
| **Recommendations** | Read an action's supporting evidence, proposed SQL, and status, and, for withdrawn recommendations, the reason the action no longer applies. |
| **#check-ins** | Review the history of check-ins. Use an entry's **Updated reports** and **Transcript** controls to inspect its reports and activity. |
| **Alerts** | Inspect the alert rules Aegis monitors and their current state. |
| **Custom instructions** | Provide ongoing cluster context for check-ins, as described in [Adaptive Learning](#adaptive-learning). |
*Home brings together the connected cluster's latest summary, recommendations, and check-in history.*
### Find reports, recommendations, and activity
Use the workspace navigation to find the information relevant to your task:
| Destination | Use it to |
| ----------------------- | -------------------------------------------------------------------------------------------------------------------------------------------- |
| **Home** | Review the current summary, recommendations, and recent check-ins. |
| **Recommendations** | Read an action's supporting evidence, proposed SQL, and status, and, for withdrawn recommendations, the reason the action no longer applies. |
| **#check-ins** | Review the history of check-ins. Use an entry's **Updated reports** and **Transcript** controls to inspect its reports and activity. |
| **Alerts** | Inspect the alert rules Aegis monitors and their current state. |
| **Custom instructions** | Provide ongoing cluster context for check-ins, as described in [Adaptive Learning](#adaptive-learning). |
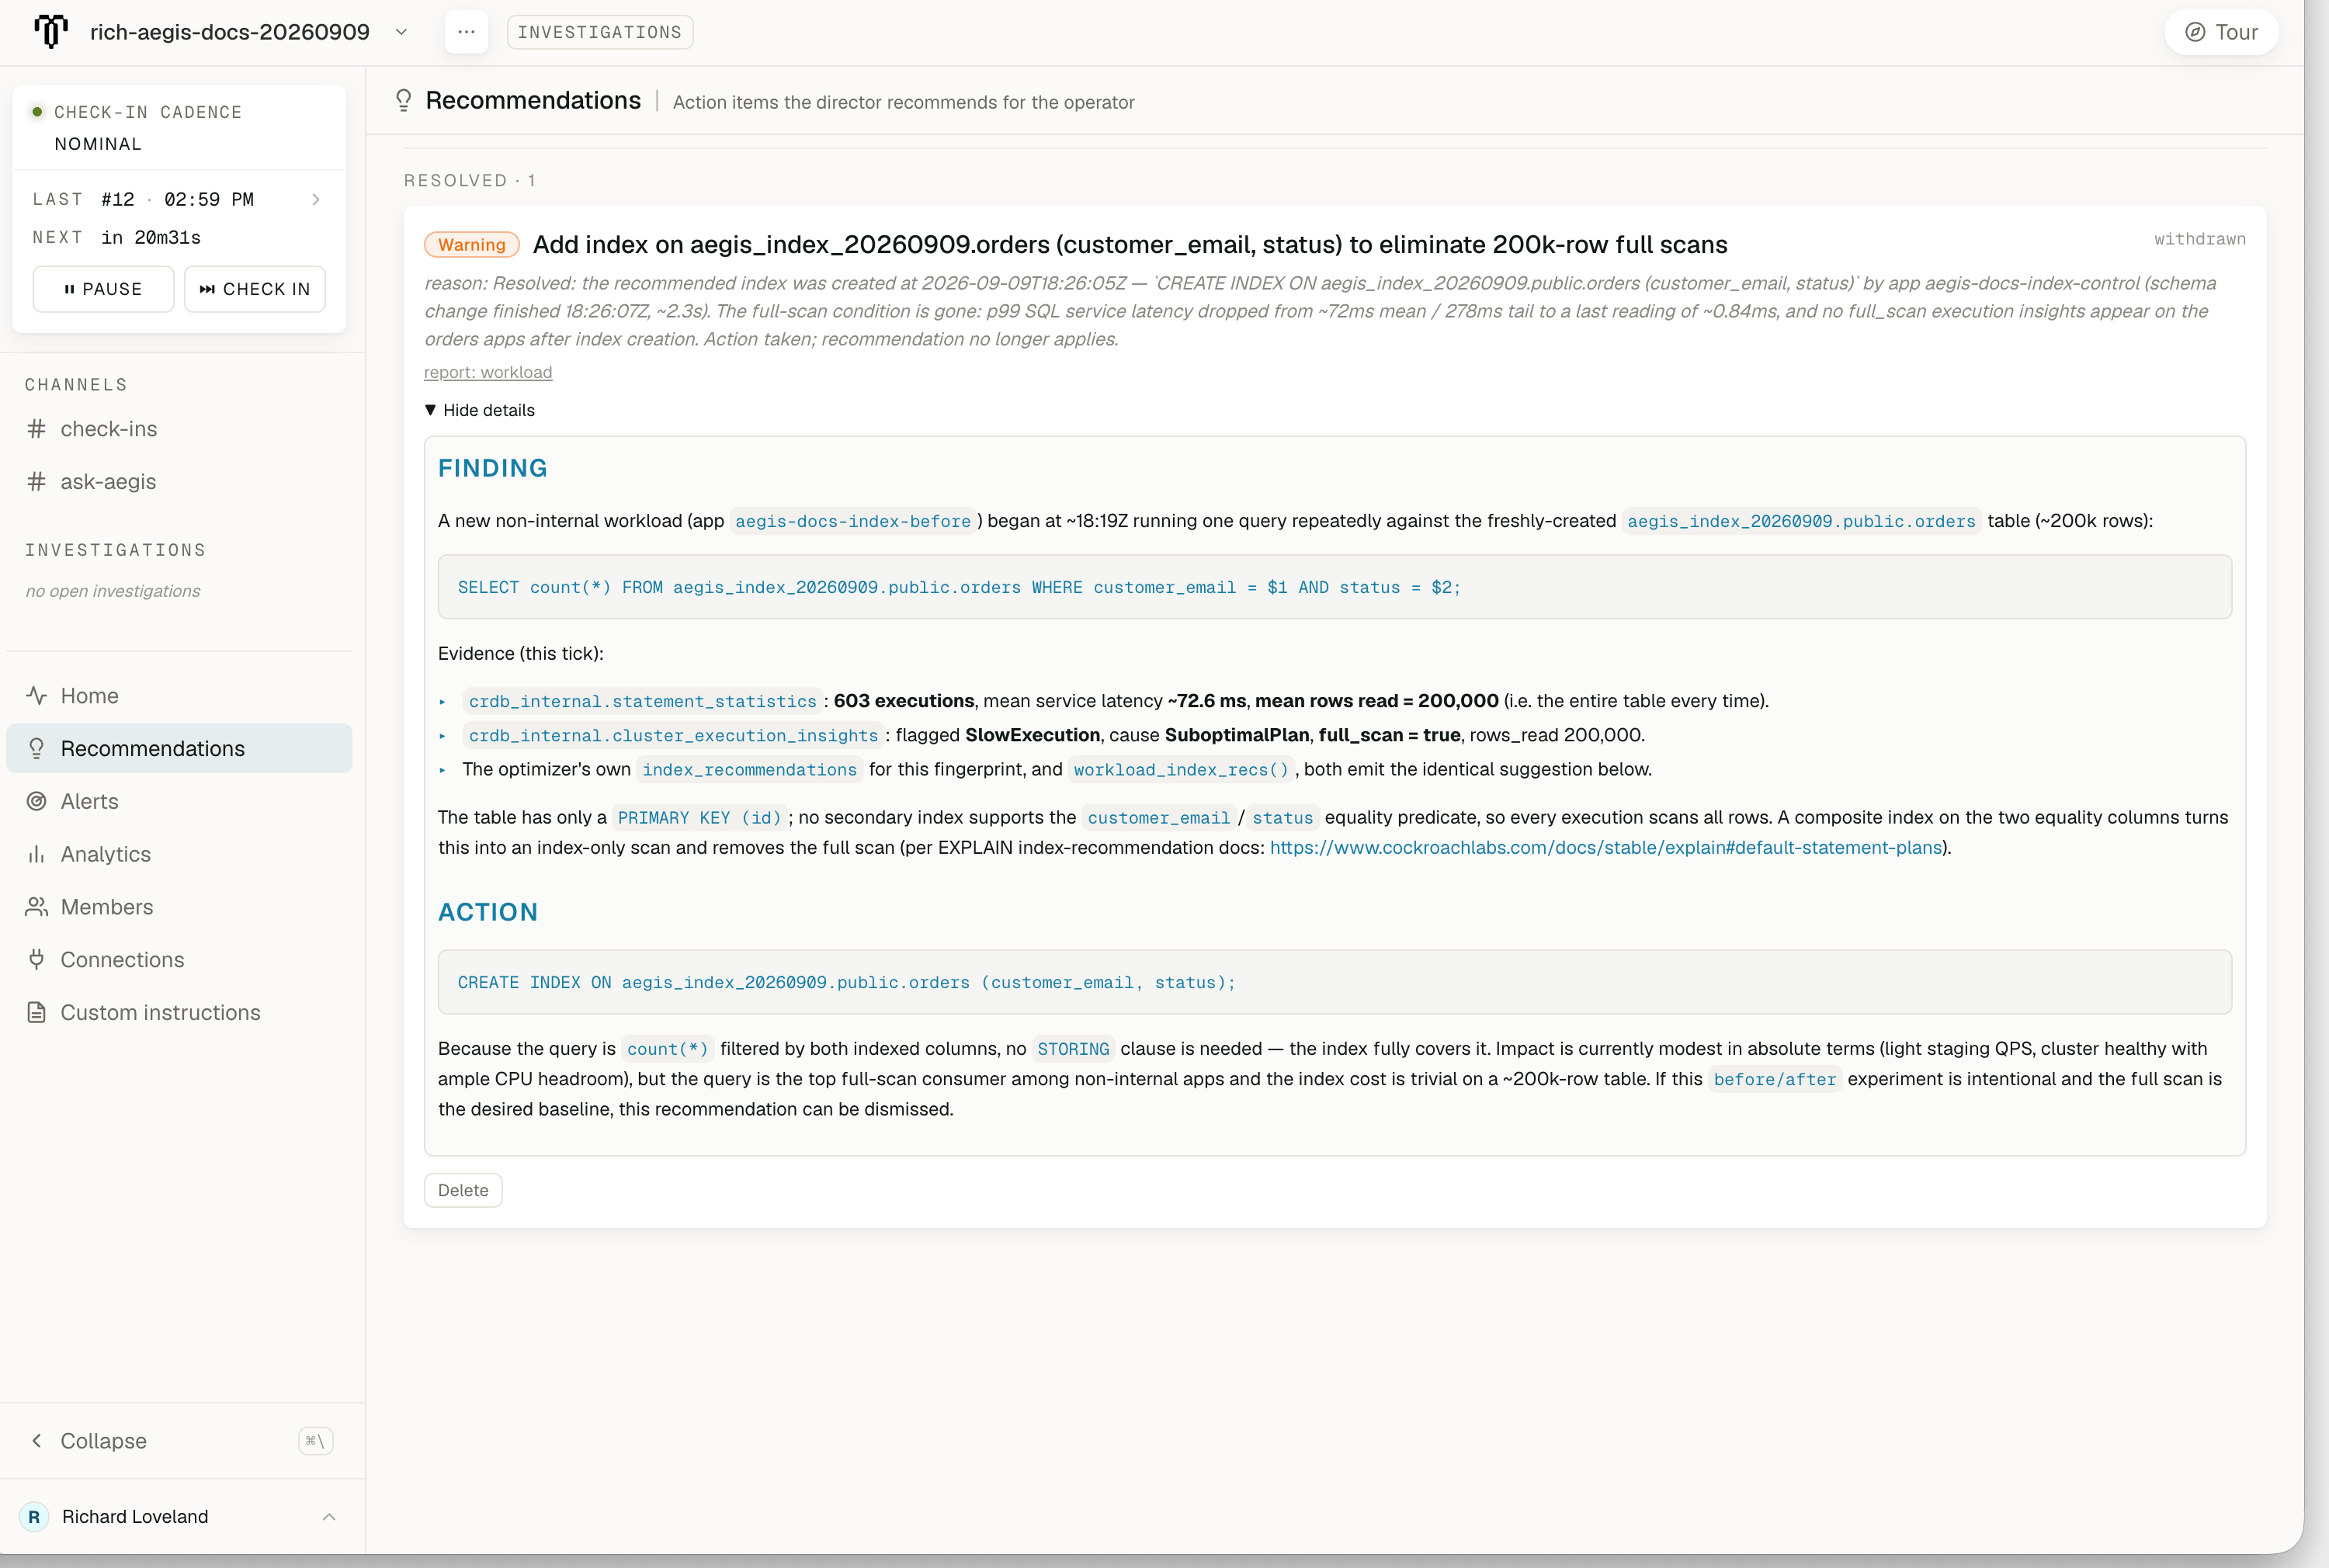 *An index recommendation after the index was applied. Aegis retains the finding, evidence, and proposed SQL, marks the status `withdrawn`, and records the reason the action no longer applies.*
When investigations are open, they appear in the **Investigations** section. For more information, see [Intelligent Alerting and Investigations](#intelligent-alerting-and-investigations).
To request a check-in from the workspace, click **Check in** in the **Check-in cadence** panel.
For worked examples of interpreting contention and acting on an index recommendation, see [Aegis Example Workflows](/docs/continuum/aegis-example-workflows).
### Ask Aegis: Cluster-aware Q\&A
To open Ask Aegis, select **#ask-aegis** in the workspace's **Channels** section. Ask a question about the cluster, or follow up on a report or recommendation.
Ask Aegis has access to the same cluster context and tools that Aegis uses during check-ins, and it can consult the CockroachDB documentation to explain its answers. For example, ask:
* How is this cluster looking overall right now?
* What changed in this cluster's workload since the previous check-in?
* What evidence supports this index recommendation?
* What did the investigation find about the increase in latency?
In the conversation shown below, the answer to the first question described an idle, healthy cluster, noted the single-node cluster's lack of fault tolerance, and cited the cluster and workload reports along with fresh metrics, node-liveness, and event-log observations. When you assess an answer, compare the report times with the observation window it states, since a report and a live observation can describe different periods.
*An index recommendation after the index was applied. Aegis retains the finding, evidence, and proposed SQL, marks the status `withdrawn`, and records the reason the action no longer applies.*
When investigations are open, they appear in the **Investigations** section. For more information, see [Intelligent Alerting and Investigations](#intelligent-alerting-and-investigations).
To request a check-in from the workspace, click **Check in** in the **Check-in cadence** panel.
For worked examples of interpreting contention and acting on an index recommendation, see [Aegis Example Workflows](/docs/continuum/aegis-example-workflows).
### Ask Aegis: Cluster-aware Q\&A
To open Ask Aegis, select **#ask-aegis** in the workspace's **Channels** section. Ask a question about the cluster, or follow up on a report or recommendation.
Ask Aegis has access to the same cluster context and tools that Aegis uses during check-ins, and it can consult the CockroachDB documentation to explain its answers. For example, ask:
* How is this cluster looking overall right now?
* What changed in this cluster's workload since the previous check-in?
* What evidence supports this index recommendation?
* What did the investigation find about the increase in latency?
In the conversation shown below, the answer to the first question described an idle, healthy cluster, noted the single-node cluster's lack of fault tolerance, and cited the cluster and workload reports along with fresh metrics, node-liveness, and event-log observations. When you assess an answer, compare the report times with the observation window it states, since a report and a live observation can describe different periods.
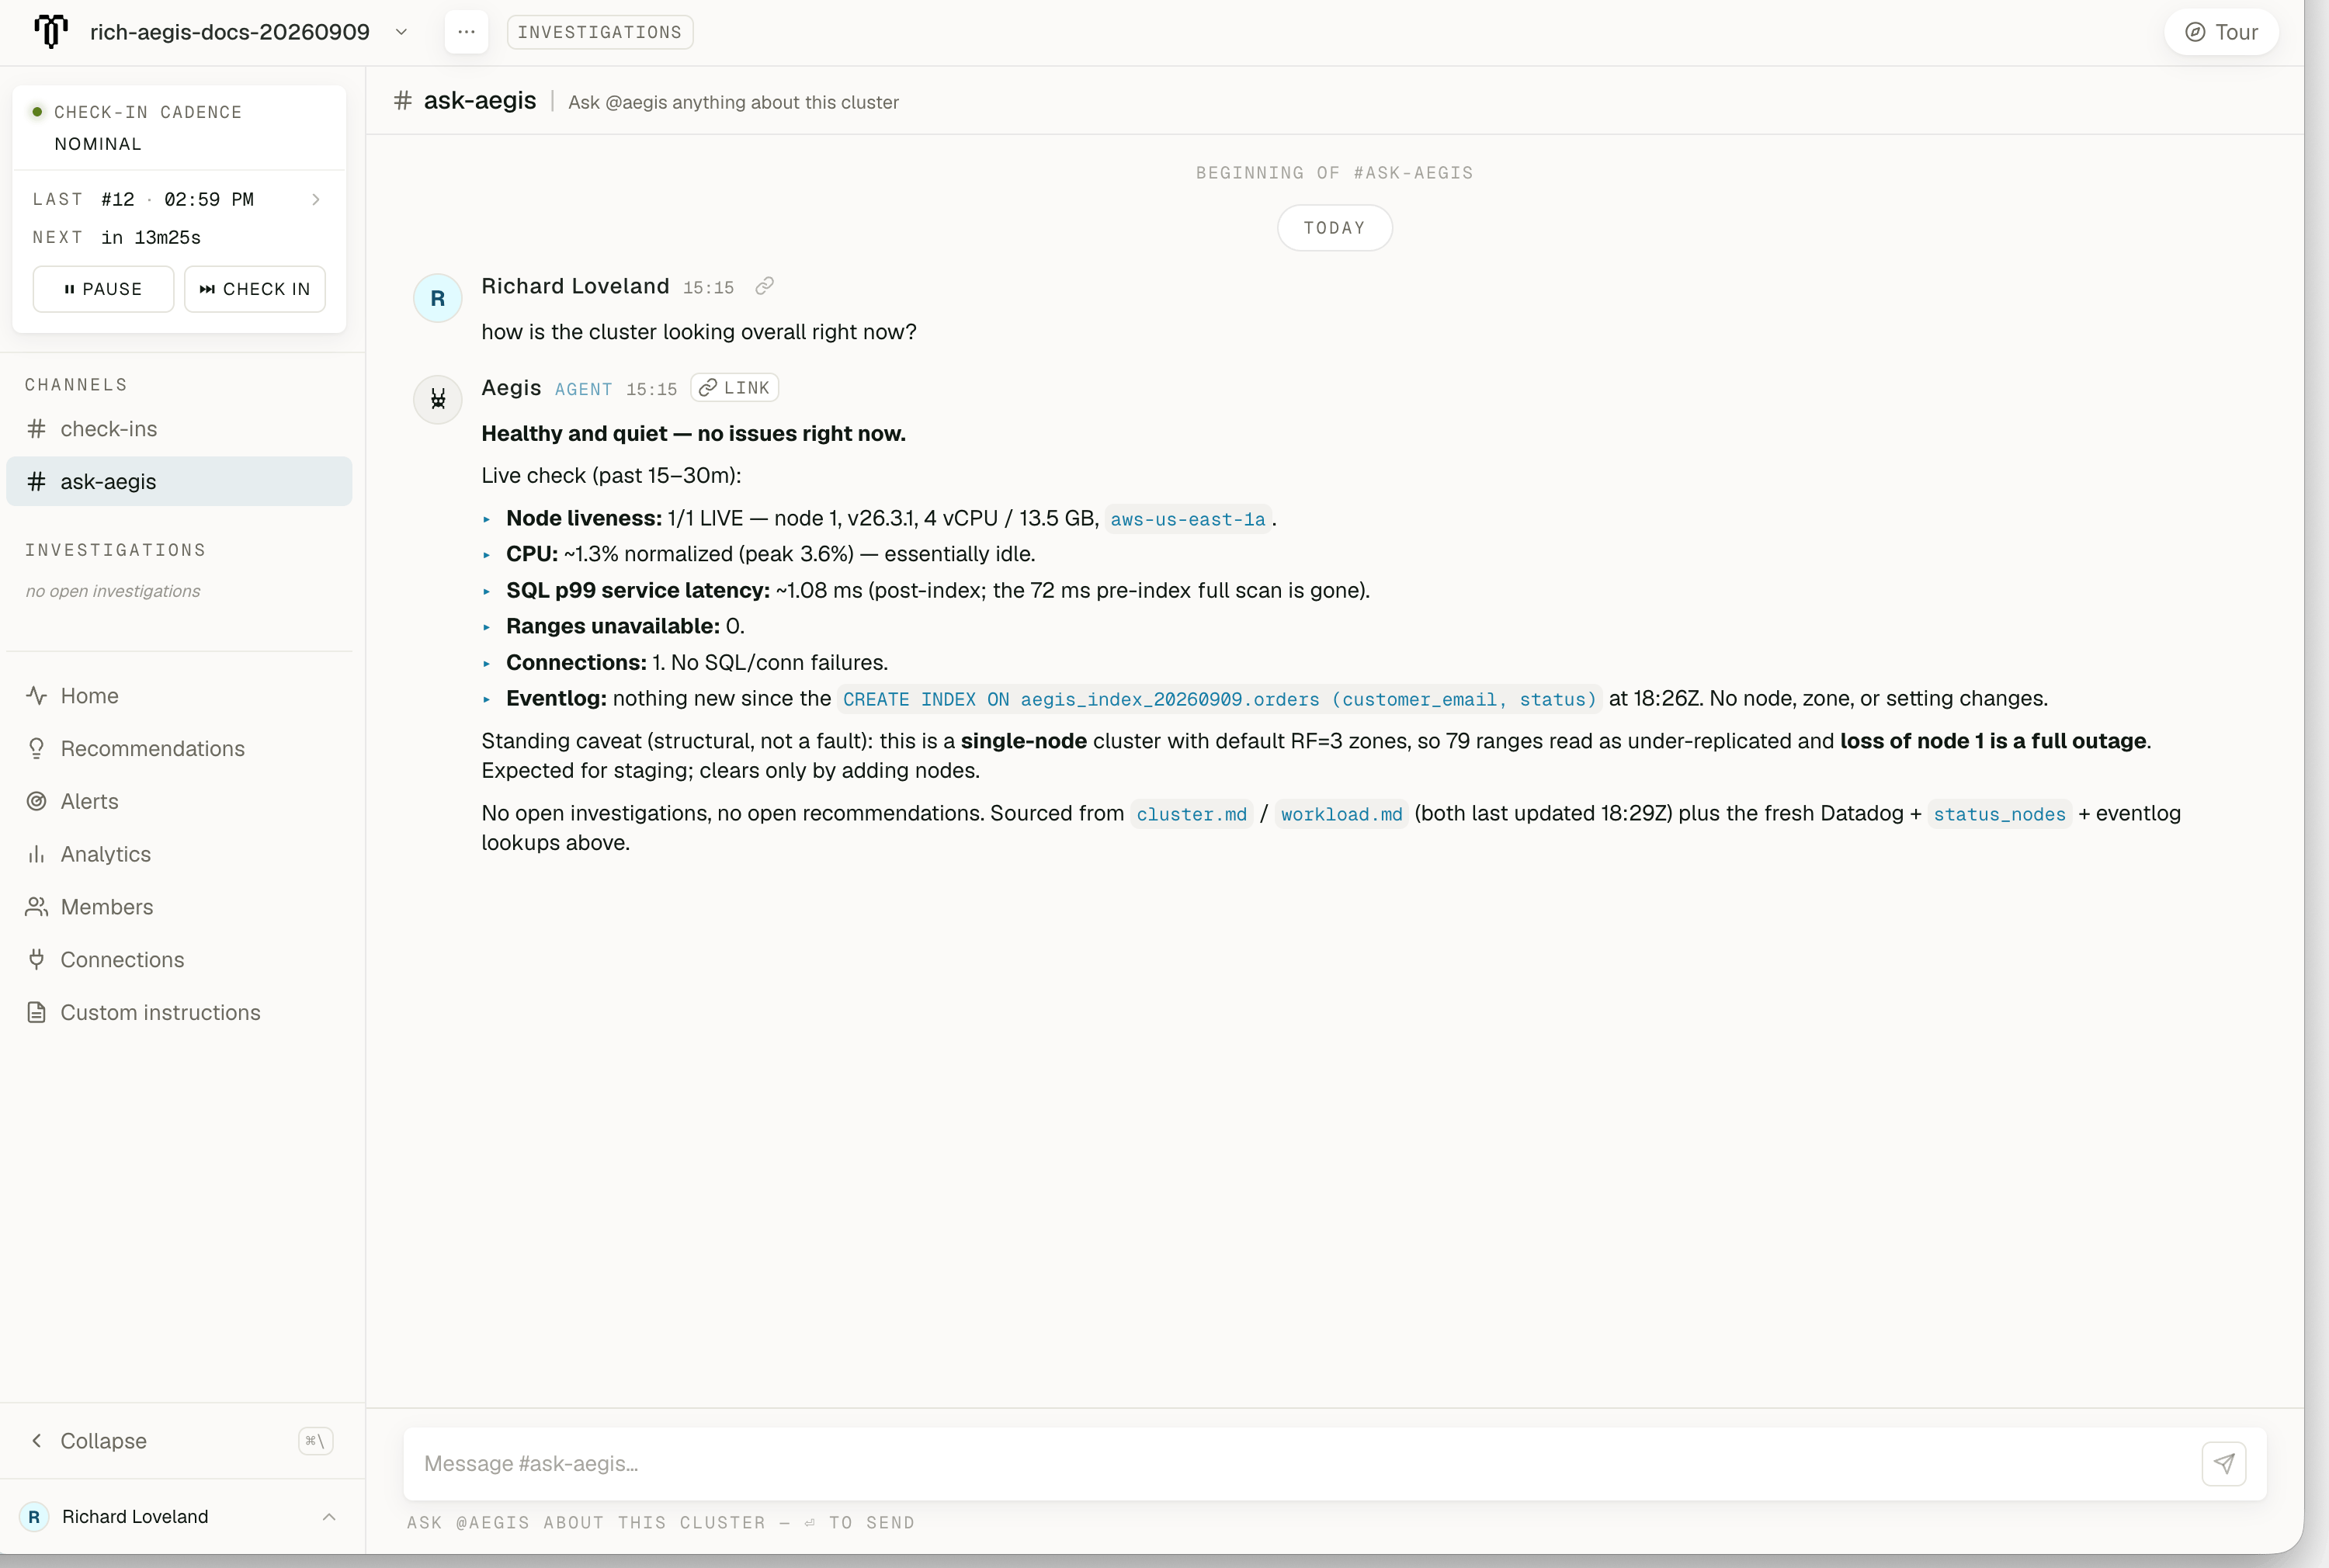 *An Ask Aegis conversation about a cluster's health, including the answer's stated sources and observation window.*
## Demo video
For a demonstration of how to use Cockroach Aegis, watch the following video:
## See also
* [Agentic Ecosystem](/docs/continuum/aegis-agentic-ecosystem)
* [Security and Administration](/docs/continuum/aegis-security-and-data-access)
* [Aegis Example Workflows](/docs/continuum/aegis-example-workflows)
*An Ask Aegis conversation about a cluster's health, including the answer's stated sources and observation window.*
## Demo video
For a demonstration of how to use Cockroach Aegis, watch the following video:
## See also
* [Agentic Ecosystem](/docs/continuum/aegis-agentic-ecosystem)
* [Security and Administration](/docs/continuum/aegis-security-and-data-access)
* [Aegis Example Workflows](/docs/continuum/aegis-example-workflows)